Blacklight

We're shining a light on the invisible bugs in science.

Errors and inconsistencies in published papers can go unnoticed, even as later research builds on them. Some are small. Others can change a study's conclusions.

Until now, finding them took hours of line-by-line review. With Blacklight, they light up.
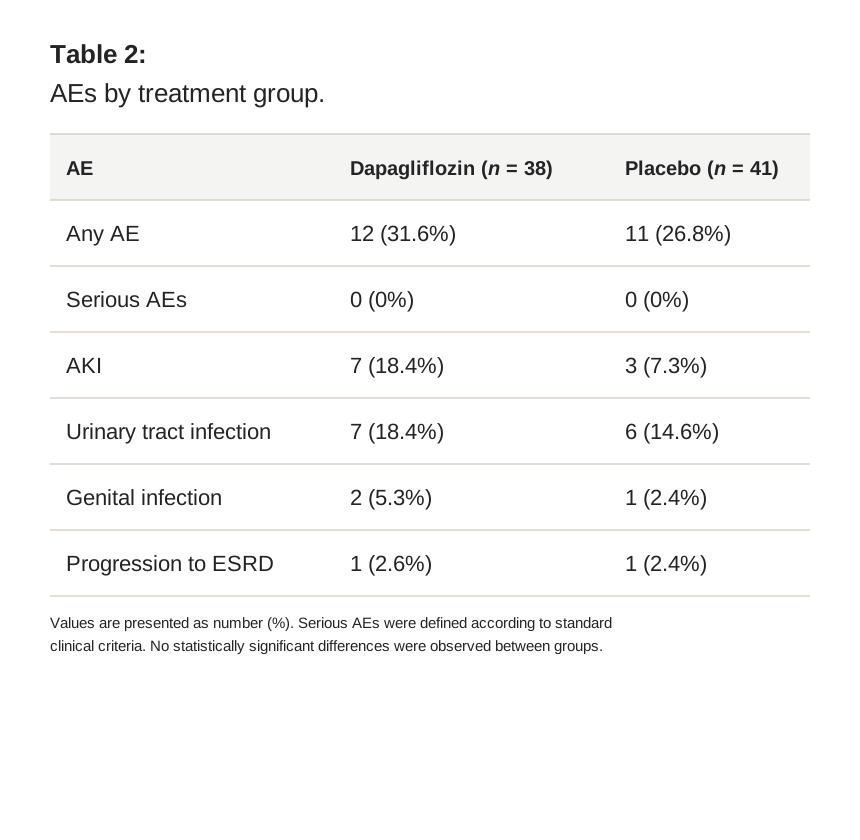
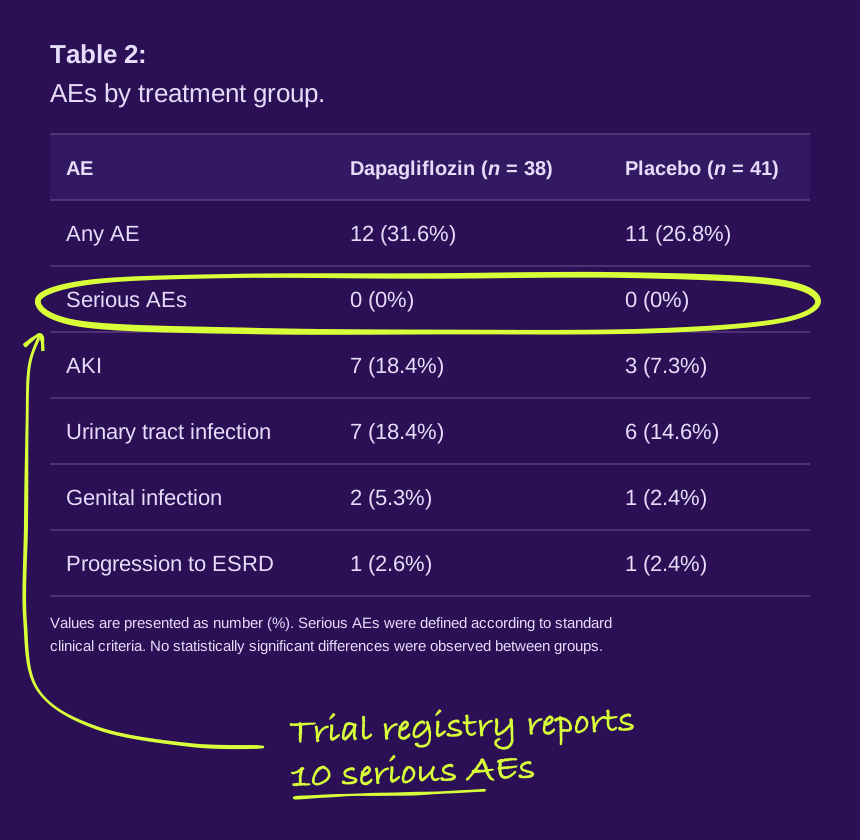
Adverse events table reporting zero serious adverse events in both treatment groups. Under the blacklight, the Serious AEs row is circled with a note: Trial registry reports 10 serious AEs.
Reconciling adverse events
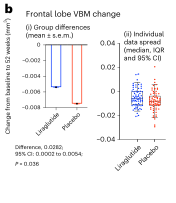
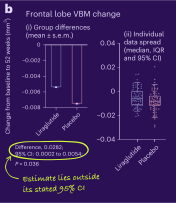
A chart of frontal lobe volume change, with a reported difference and confidence interval. Under the blacklight, the reported difference is circled with a note: Estimate lies outside its stated 95% CI.
Cross-checking statistics
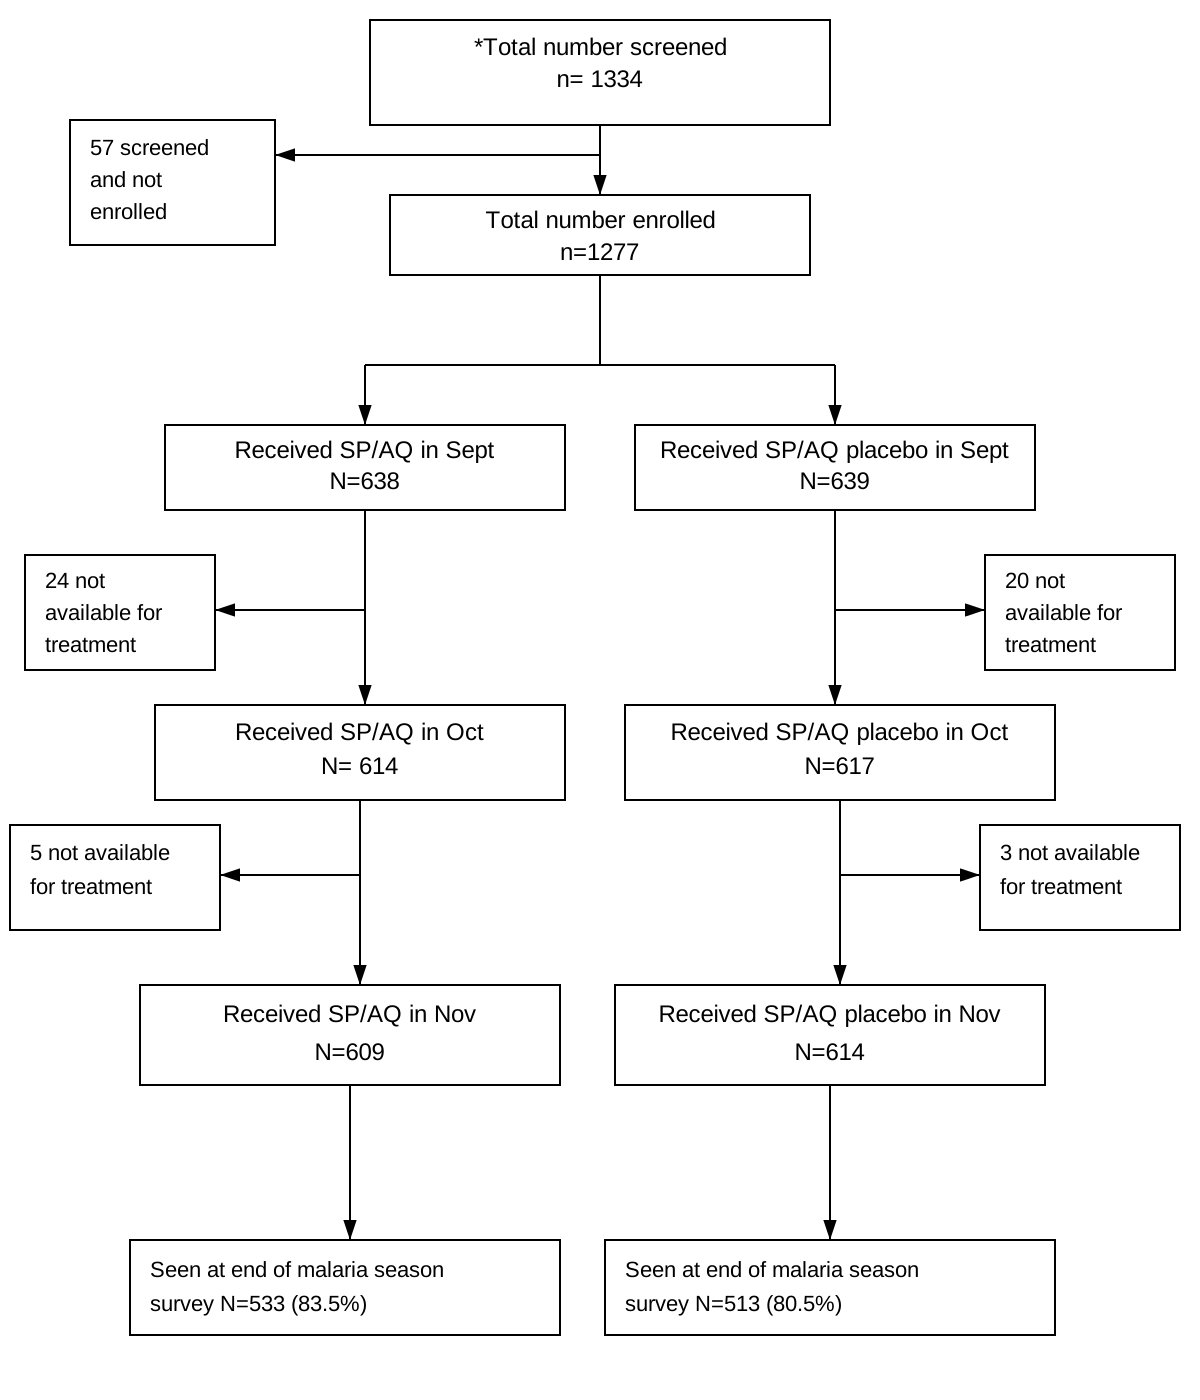
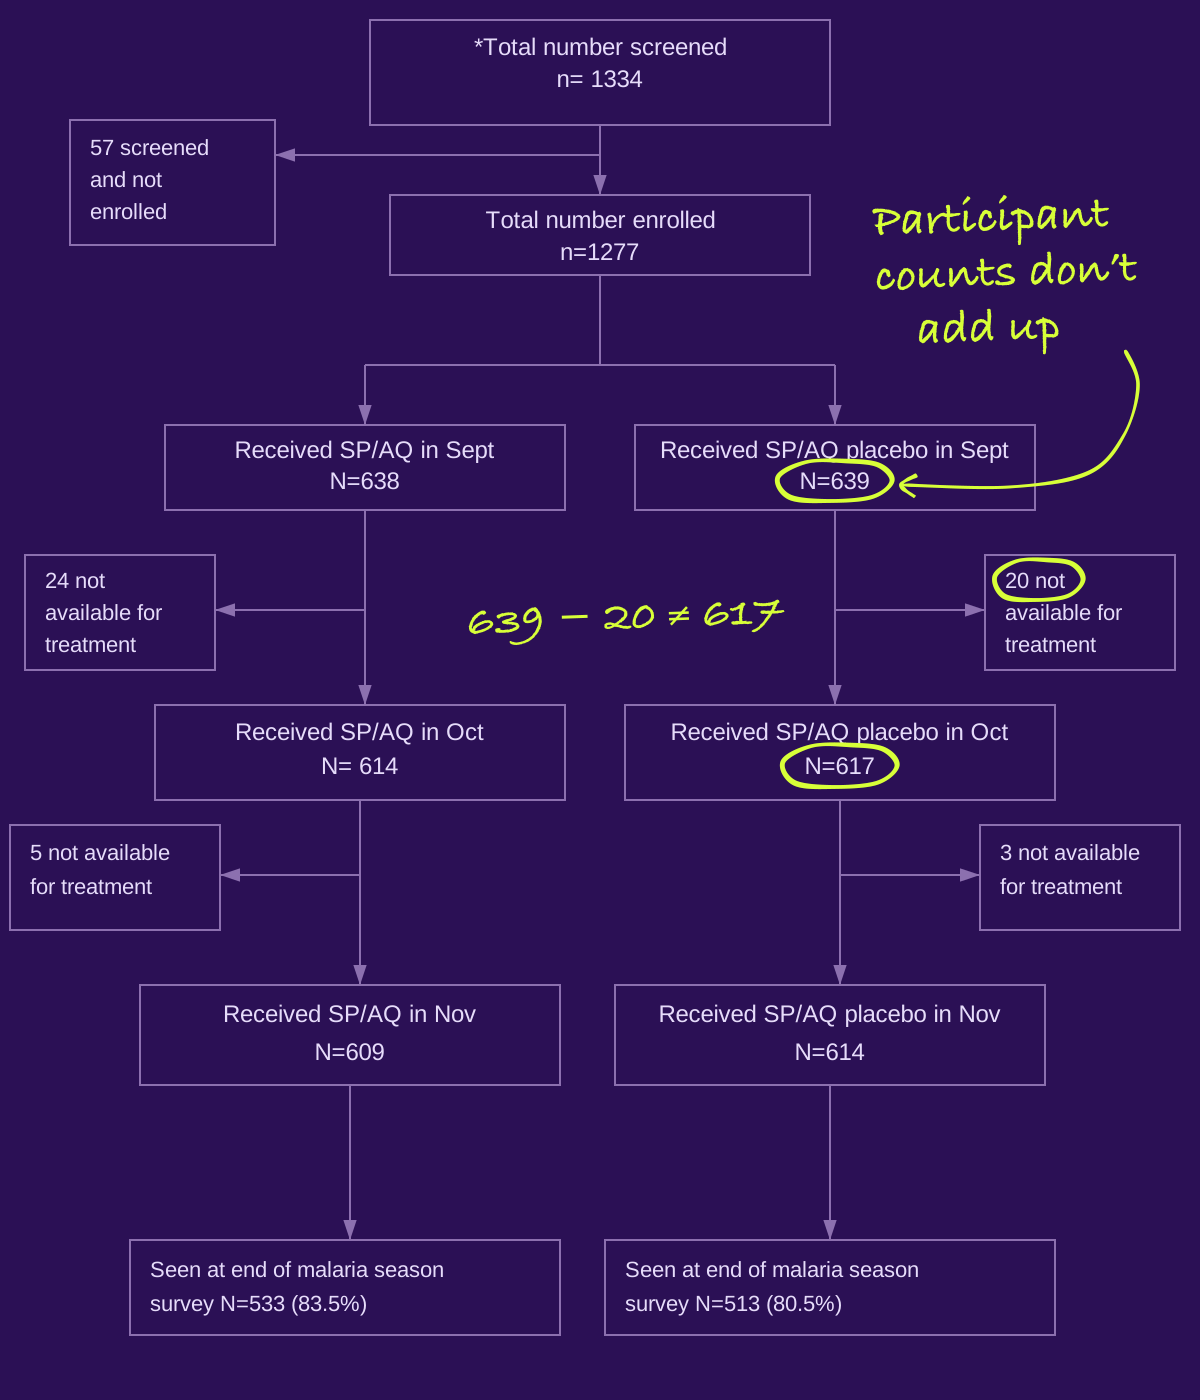
A participant flowchart reporting 639 placebo participants, 20 unavailable for treatment, and 617 receiving treatment. Under the blacklight, the counts 639, 20 and 617 are circled with a note: Participant counts don’t add up. 639 − 20 ≠ 617.
Tracking participant flows

Blacklight is built to scale. Our first goal is to review the 1.6 million randomized controlled trials on PubMed.

Interested in taking a closer look?

Contact us